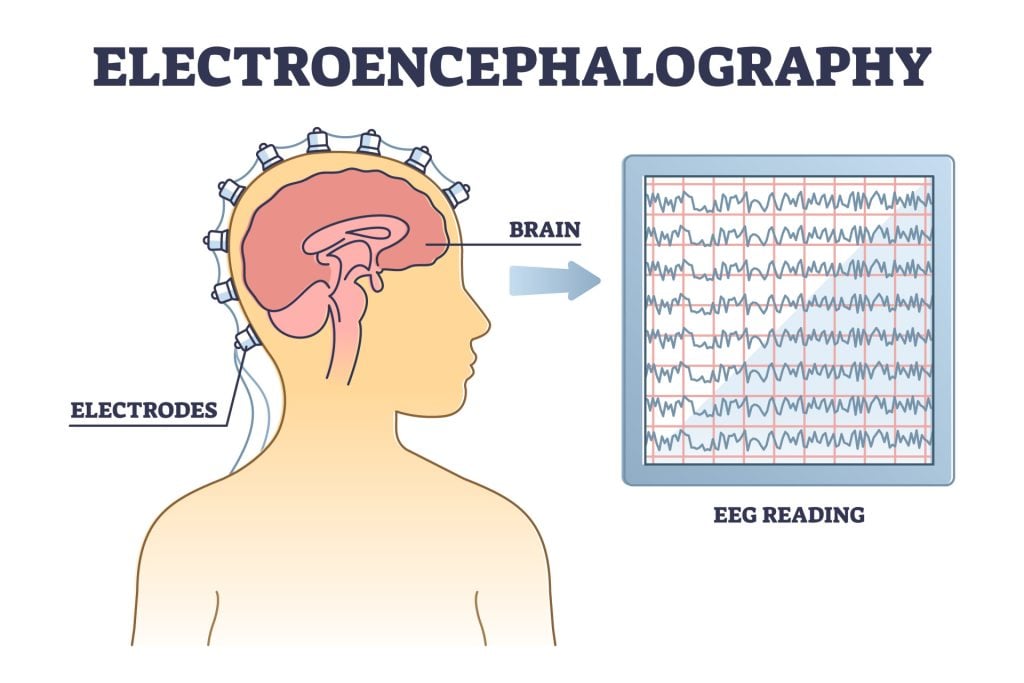
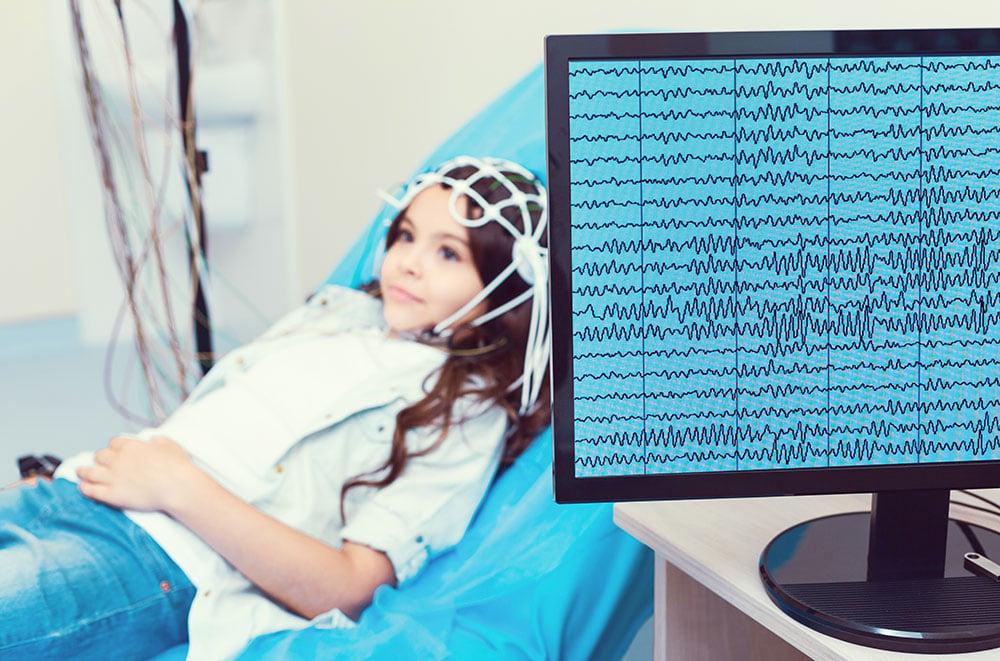
The electroencephalogram (EEG) is a non-invasive neuroimaging test that can detect and record minute changes in electrical activity within the brain. This is recorded using microelectrodes (large, flat electrodes stuck to the skin or scalp).
The electrical impulses in an EEG recording appear as wavy lines with peaks and valleys.

German physiologist Hans Berger was known as the inventor of the EEG back in 1924, where he conducted the first EEG on a human.
The cells of the brain communicate to each other via electrical impulses, which are picked up by the EEG through small metal discs, called electrodes, which get attached to the scalp.
The electrodes cannot pick up signals for individual neurons. The recording shows the electrical activity from small areas of the brain. EEG is used to show the presence or absence of specific brain activity in specific areas of the brain, with an accuracy within milliseconds.
The electrodes of the EEG analyze the electrical impulses that are being communicated in the brain, which then gets transmitted to a computer which monitors the results.
The electrical activity in the brain is driven by neuronal activity (action potentials) or nerve impulses. This is how neurons pass messages to each other for behaviors, thoughts, and other conscious or unconscious processes to occur.
EEGs record the electrical activity for a period of time to be able to indicate the level of activity in the brain. These electrical impulses are displayed as wavy lines on an EEG recording.
Purpose of Test
A doctor may advise the use of an EEG to be able to diagnose several conditions. As an EEG can determine changes in brain activity, this is a useful method for diagnosing brain disorders.
Below are some of the conditions which can be detected and measured from an EEG:
- Epilepsy and other seizure disorders
- Brain damage as a result of a head injury
- Stroke
- Inflammation of the brain
- Sleep disorders
- Dementia
- Other dysfunctions of the brain
EEG Test Preparation
When preparing to have an EEG, it is usually advisable to wash your hair the night before or on the day of the test, and to not use conditioners. This is because hair products can make it more difficult for the electrodes to adhere to the scalp.
It is also advisable not to consume anything with caffeine or alcohol as this may affect the results.
Typically, you should be allowed to take your usual medications unless otherwise instructed by the doctor.
If you are supposed to be sleeping during your EEG test, your doctor may advise you to not sleep the night before, or to sleep less, so that you are able to take part in the test.
EEG Procedure
Below is a list of steps that can be expected to happen during an EEG:
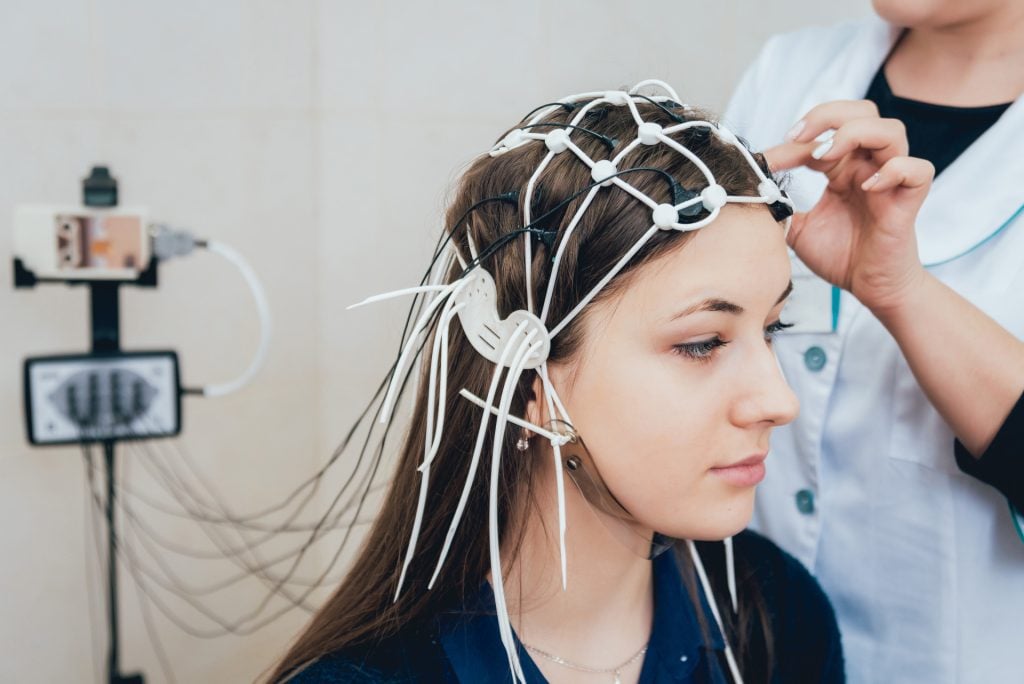
- A technician will measure your head and use a pencil to make marks on the scalp. These marks are used to indicate where the electrodes will be attached.
- The technician will then attach the electrodes to your scalp on the marks they previously indicated. These electrodes are attached by an adhesive and are connected with wires to an instrument that is used to amplify the brain waves. Between 16 and 25 electrodes will be attached to your scalp in several places.
- You may be asked to relax in a comfortable position with your eyes closed and perhaps perform some simple tasks such as reading, completing calculations or looking at a light. Depending on the type of test or experiment, you may be asked to perform other cognitive based tasks, or you may be required to sleep during the test.
- The EEG will usually take up to 60 minutes to complete. If being asleep is required during the test, the EEG could last a lot longer than 60 minutes.
- Once the test is completed, the electrodes will be removed, and the adhesive paste will be washed off. If sedatives have been taken for the test, you may be required to rest until they have worn off and may need someone to drive you home.
Interpreting Results
The electrodes that detect electrical activity will appear either as a graph or on a computer screen and will then be interpreted and sent to the doctor if testing for a diagnosis.
The doctor then might want to schedule an appointment to discuss the results of the test. Special attention will be paid to the basic waveforms, ensuring they follow the normal patterns of frequency.
Attention will also be paid to the bursts of energy and responses to certain stimuli, such as flashing lights.
Abnormal EEG wave patterns could be a result of one of the following:
- Epilepsy and other seizure disorders
- Sleep disorders
- Alcohol or drug abuse
- Head injury
- Migraines
- Abnormal bleeding on the brain
- Swelling of the brain
- Blockage of blood flow to or around the brain
EEGs are the neuroimaging technique of choice for epilepsy. Epileptic seizures are caused by disturbed brain activity which can be very sudden.
Seizure activity on an EEG will typically appear as rapid spiking waves. Spikes are very fast waves and called so due to their shape, lasting as little as less than 80 milliseconds and standing out on an EEG.
Focal seizures, which occur in just one area of the brain, can only be seen on electrodes on the part of the brain the seizure is occurring in.
Typically the one electrode can display spikes of activity on the EEG, whereas the other electrodes would only pick up normal brain activity as the seizure is not happening there.
In generalized seizures, which affect all or most of the brain, the heightened activity can be detected by all the electrodes.
Individuals who have suffered damage to the brain as a result of a stroke or a tumor may present as having abnormally slow EEG waves depending on the size and location of the damage.
EEGs can also be used to evaluate the electrical activity of the brain of coma patients to determine the levels of brain activity they have. These can also be used to determine activity as a result of a trauma or drug intoxication, as well as monitor blood flow in the brain during surgical procedures.
In the field of psychology, EEGs are typically used to record cognitive processes. Comparisons can be made between a resting brain and when presented with a task or stimulus to examine activity in the brain.
Through the electrodes placed on different areas of the scalp, EEGs can be used to determine which parts of the brain correspond with certain behaviors.
Brain Waves
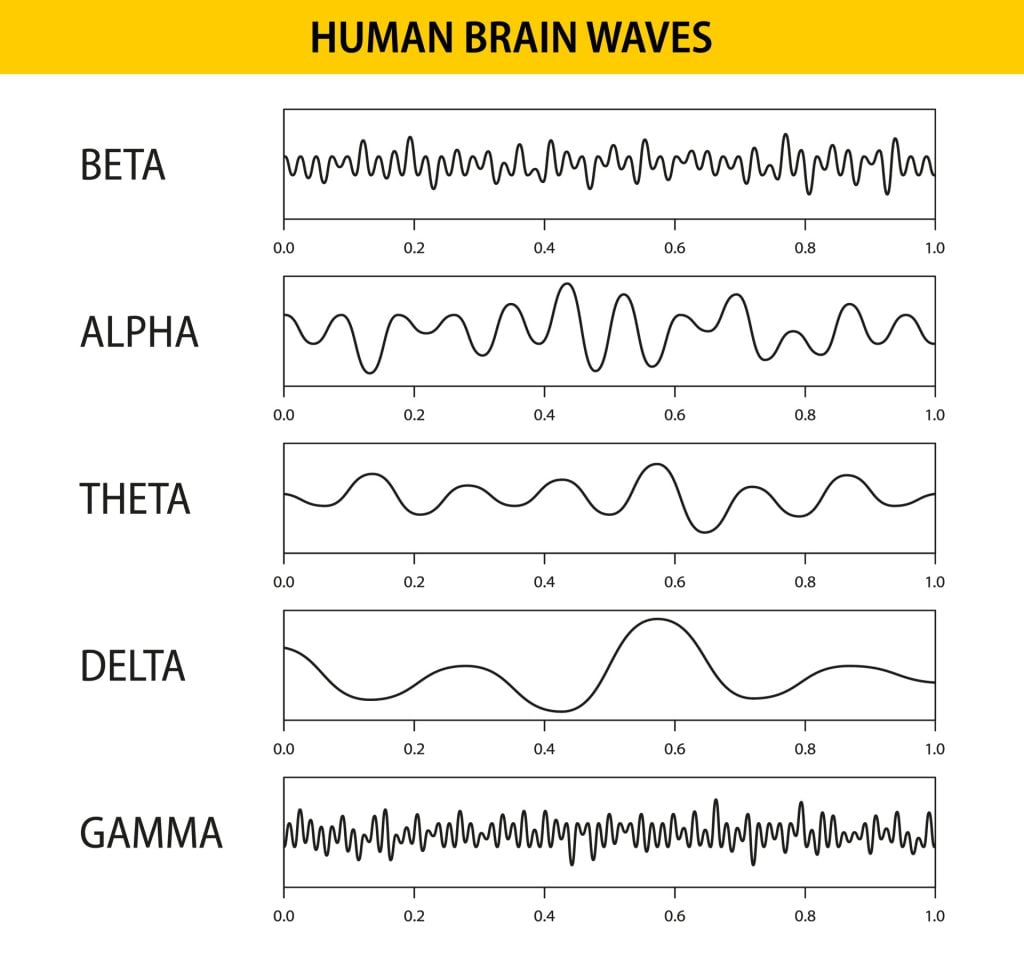
EEG produces a chart (an encephalogram) that shows how ‘brain waves’ vary by frequency (number of waves per second) and amplitude (height) of electrical output from the brain changes over time.
Four types of EEG patterns can be noticed on a recording: alpha waves, beta waves, theta waves, delta, and gamma waves.
These five patterns have two basic properties which are examined by doctors and psychologists.
The first is amplitude, which shows the intensity or the size of the activity. The other is the frequency, which is the quantity or the speed of activity. The frequency is the number of wave cycles per second, also known as hertz (Hz).

Below are descriptions of the types of EEG patterns:
Alpha Waves
Alpha waves have a frequency range of around 8-13 waves per second. Hans Berger named this, being the first type of rhythmic EEG activity he saw.
Alpha waves are typically witnessed in people who are awake, with their eyes open or closed, often in a relaxed state. It is noted that alpha waves are most visible in the occipital lobes of the brain, which is the area responsible for vision.
Also, most alpha activity tends to be higher in amplitude on the dominant side of the brain in most people.
Beta Waves
Beta waves have a frequency greater than 13 per second, the usual range being from 13 to about 30Hz.
Beta waves are typically seen in people who are awake, with their eyes either opened or closed and are often viewed in the frontal lobes, which is where most conscious thought and movement occur.
Low amplitude which has varying frequencies, is most often associated with active thinking, concentration, and anxious thoughts.
Theta Waves
This pattern of activity usually has a frequency of around 4-7 waves per second. These waves are also known as slow activity, typically occurring during sleep, meditation, and in younger children.
If there is an excess of theta activity in older children and adults, this could represent abnormal activity and could relate to drowsiness.
Delta Waves
These waves have a frequency of up to 4Hz, and so are the slowest waves. However, delta waves seem to be the highest in amplitude, so they have the strongest intensity.
This wave pattern is most commonly witnessed during slow wave sleep and infants under the age of 1 year old.
Gamma Waves
Gamma waves have a frequency with a range of 30Hz and above.
To conclude, different levels of consciousness appear differently on an EEG. For instance, when awake, the wave patterns tend to move faster than when asleep.
If the frequency of the wave patterns corresponds within the normal range of frequency, this is considered normal activity.
If the frequency is out of range of the normal wave pattern, this could be a sign of abnormal activity and may even suggest a type of brain disorder.
EEG patterns can produce either a synchronized or a desynchronized pattern. Synchronized patters occur when a recognizable waveform is detected (either alpha, beta, theta, or delta).
A desynchronized pattern occurs when no recognizable pattern can be detected.
What are the Risks of an EEG?
EEGs have been in use for many years and are considered a safe procedure, causing no discomfort. As the electrodes do not produce any sensations, there is very little risk, they cause no discomfort, and there is no risk of getting an electric shock.
EEGs are a non-invasive technique, meaning it does not involve any equipment going into the body. This makes EEGs a good choice in research, especially with younger participants.

The need for the participants to remain still are not required as much as with other neuroimaging methods such as with magnetic resonance imaging (MRI). Therefore, participants can carry out a variety of tasks or normal ongoing behaviors for an experiment without the worry of data being disrupted due to movements.
Another advantage of EEGs is that it has very high temporal resolution, meaning it can pick up frequencies really quickly, often within a single millisecond.
In comparison to other neuroimaging techniques such as MRI or positron emission tomography (PET), EEGs hold a strong advantage over these in terms of temporal resolution and cost-effectiveness. Similarly, many other neuroimaging methods will record changes in blood flow or metabolic activity, which are indirect markers of brain activity.
EEGs, however, can measure the brain’s electrical activity directly, making it more efficient in this sense.
Despite these strengths, EEGs main limitation is that it has poor spatial resolution. Spatial resolution refers to the capacity a neuroimaging technique has to show exactly which area of the brain is active.
The skull can often behave like a filter and may distort the electrical activity going on in the brain. Any electrical activity detected by electrodes have the potential to be generated by multiple areas within the brain, making it difficult to pinpoint exactly where the activity is taking place.
This is why neuroscientists would discuss EEG activity generated at specific electrode locations rather than concluding that a certain part of the brain generated the activity.
Research studies
- A study by Coutin-Churchman et al. (2003) used EEG to evaluate and specify measures of abnormal EEG results in those with mental health conditions, in comparison to a control group of people without a mental health condition.
- It was found that EEG results were abnormal in 83% of those with mental health conditions.
- The most frequent difference was a decrease in delta and theta waves, either alone or alongside increases in beta waves, or with alpha decrease, followed by an increase in beta waves. The researchers concluded that the apparent decreases in delta and theta waves on the EEG are an indicator of brain dysfunctions associated with mental health conditions.
- Another study by Bell (2012) used EEG to investigate the working memory performance of fifty 8-month-old infants.
- It was found that performance on a working memory task was associated with an increased in EEG coherence in the frontal-parietal regions from baseline to task.
- There were also elevated levels of frontal-occipital coherence during both the baseline and task. Therefore, EEG was able to identify differences in brain activation between those who performed better and worse on a task.
References
Bell, M. A. (2012). A psychobiological perspective on working memory performance at 8 months of age. Child Development, 83 (1), 251-265.
Coutin-Churchman, P., Anez, Y., Uzcategui, M., Alvarez, L., Vergara, F., Mendez, L., & Fleitas, R. (2003). Quantitative spectral analysis of EEG in psychiatry revisited: drawing signs out of numbers in a clinical setting. Clinical Neurophysiology, 114 (12), 2294-2306.
Mayo Clinic. (April 15, 2020). EEG (Electroencephalogram) . https://www.mayoclinic.org/tests-procedures/eeg/about/pac-20393875


